2/12/2025
Corn Seeding Rate Considerations

Crop Insights
Written by Mark Jeschke, Ph.D., Pioneer Agronomy Manager
Key Points
- Improvement of corn hybrid genetics for superior stress tolerance has allowed hybrids to be planted at higher plant populations and produce greater yields.
- An analysis of Pioneer plant population data collected over a 30-year period showed that optimum plant populations increased from an average of 30,500 plants/acre in the late 1980s to 37,900 plants/acre in the mid-2010s.
- In general, corn response to plant population follows a quadratic response model in which yield increases with greater plant population up to an optimum point, beyond which yield declines.
- Optimum plant population can vary depending on field productivity level and can differ among hybrids.
- Corteva scientists evaluate the plant population response of Pioneer® brand corn products at numerous locations in the U.S. and Canada each year.
- The Pioneer Planting Rate Estimator, available on www.pioneer.com, allows users to generate estimated optimum seeding rates for Pioneer brand corn products based on data from Corteva research studies.
Higher Density Drives Higher Yields
One of the most critical management factors in corn production is establishing a sufficient population density to allow a corn hybrid to maximize its yield potential. Historically, population density has been the main driver of yield gain in corn. Improvement of corn hybrid genetics for superior stress tolerance has allowed hybrids to be planted at higher plant populations, which has driven higher yields.
Optimum plant density depends on the productivity level of the field – more productive environments generally maximize corn yield potential at higher plant densities. Optimum plant density can also vary by hybrid genetics – some hybrids will maximize yield potential at a higher or lower density than others.

The goal for corn producers is to plant at the economically optimum seeding rate – the point at with the return on seed investment is maximized. In order to help corn producers achieve this goal, Corteva scientists conduct numerous research trials each year across North America to evaluate plant population response of Pioneer® brand corn products across a wide range of growing environments.
Plant Population Trends
The critical role that higher plant density has played in corn yield gains over time means that one of most important objectives of corn plant population research is simply to ensure that grower management practices are keeping pace with the genetic potential of modern corn hybrids. Planting corn at the same population as 20 or 30 years ago would result in lost yield potential and profitability.
The continual increase in optimum plant density throughout the hybrid corn era has been well-documented by research. An analysis of Pioneer plant population data collected over a 30-year period showed that the agronomically optimum plant population increased from an average of 30,500 plants/acre in the late 1980s to 37,900 plants/acre in the mid-2010s (Figure 1).

Figure 1. Agronomic optimum plant density averaged over all Pioneer® brand hybrids for six 5-year time periods from 1987 to 2016 (Ciampitti, 2018a).
Farmers have taken advantage of the higher stress tolerance of modern hybrids by pushing plant populations higher. The most extensive USDA-NASS corn population dataset is for the state of Iowa, dating back to 1963. From 1963 to 2024, average plant population and average corn yield in Iowa both continuously increased (Figure 2). Trendline corn yield increased 170% over this period, from 74.5 bu/acre to 200.3 bu/acre (2.06 bu/acre/ year). Trendline plant population increased 118%, from 15,200 plants/acre to 33,100 plants/acre (294 plants/acre/year). Greater yield per plant contributed to yield gains over this period as well, but not to the same extent as plant population, increasing only 18% from 1963 to 2024.

Figure 2. Average corn plant population and average corn yield in Iowa from 1963 to 2024 (USDA-NASS, 2025).
Plant population data for the ten largest corn-producing states shows a great deal of variation, both in current practices and trends over the past 20 years, illustrating the need to tailor corn population to the growing environment (Figure 3). Average population is highest in Illinois, at over 32,000 plants/acre, Indiana, Iowa, Minnesota, Ohio, and Wisconsin all above 30,000 plants/acre. In western states where corn yields are limited by water availability, plant populations are considerably lower. Nebraska and South Dakota have average populations around 26,000 plants/acre and Kansas only 23,000 plants/acre. In Nebraska, where populations are reported for both irrigated and dryland production, populations are around 6,000 plants/acre greater on the higher-yielding irrigated acres.

Figure 3. Average corn plant populations for major corn-producing states and rate of increase in plants/acre/year (USDA NASS, 2025).
Average populations increased in all ten states over the past 20 years, but by varying degrees. Illinois, Missouri, and Ohio had the largest increases over this time period, at over 200 plants/acre/year, while Kansas had the smallest increase.
Corteva Corn Population Research
Pioneer has been conducting corn population studies for essentially its entire century-long history. Over the past few decades, corn population studies have been conducted in a comprehensive research program spanning corn production areas in the U.S. and Canada. These studies involve numerous hybrids covering a wide range of maturities, each tested at multiple locations representing a diverse range of growing conditions. Corteva scientists target representative environments based on maturity zone, expected yield (high or low), specific stresses, and other unique location characteristics. Hybrids are generally tested over multiple years, providing a robust characterization of plant population response. Over the past several years, a subset of plant population research studies has been focused on lower-yielding dryland environments, where water availability is significantly limited due to low rainfall, sandy soils, or both.

Figure 4. Corteva Agriscience plant population research locations in North America, 2020-2024.

Figure 5. Corteva Agriscience water-limited plant population research locations in North America, 2020-2024.
An important feature of Corteva plant population research studies is the large population range over which hybrids are tested. At standard plant population research locations (not water-limited), all hybrids are tested at 18,000, 26,000, 34,000, 42,000, and 50,000 plants/acre, a range that extends well above and below the optimum plant population in most scenarios. This wide testing range is important for a couple of reasons. The high populations allow exploration of corn yield response to plant population at the highest yield levels, up to 300 bu/acre in some cases. At the other end of the range, the low populations provide a look at a hybrid’s ear flex and ability to maintain yield in scenarios where stand establishment is below the targeted level. At water-limited research locations, hybrids are tested over a lower range of populations, spanning 12,000 to 32,000 plants/acre, to evaluate hybrid performance in dryland environments.
In addition to the Corteva research studies, numerous Pioneer on-farm trials evaluating plant population response are conducted each year across the U.S. and Canada (Figure 6). These trials can be very valuable for getting a look at hybrid plant population response in local environments close to growers. On-farm trials generally focus on a narrower range of plant populations, often spanning around 10,000 to 12,000 plants/acre from the lowest to the highest population. Put together, the Corteva research studies and Pioneer on-farm trials provide wealth of data to help inform seeding rate decisions with Pioneer products. The Corteva research studies provide a robust characterization of plant population response and ear flex over multiple years and environments, while Pioneer on-farm trials provide additional local data points to help fine-tune seeding rate recommendations.

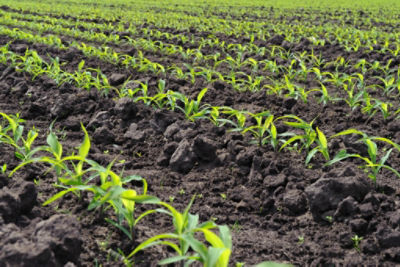
Figure 6. Pioneer Agronomy on-farm corn population trial in central Iowa prior to harvest.
Population vs. Seeding Rate
Population and seeding rate are terms that are often used interchangeably with corn, but have slightly different meanings. Population refers to the number of plants per unit area in the field; whereas, seeding rate (or planting rate) refers to the density of seeds per unit area that are planted. Because germination and emergence are never 100%, population will always be less than the seeding rate. For example, a corn hybrid with 95% warm germination would require a seeding rate of 36,800 seeds/acre to achieve a population of 35,000 plants/acre.
Agronomic vs. Economic Optimum
In general, corn hybrid response to plant population follows a quadratic response model in which yield increases with greater plant population up to an optimum point, beyond which yield declines. The agronomic optimum population is the point at which yield is maximized, while the economic optimum is the point at which profitability is maximized. The economic optimum varies depending on the cost of seed and the price at which the grain will be sold and is always less than the agronomic optimum. As yields increase with each increment of higher population, a point is reached where the yield benefit from the next addition of seed no longer exceeds the cost of the seed. Higher seed costs and lower grain sale prices will both push the economic optimum seeding rate lower, increasing the difference between the economic and agronomic optimum.
Field Productivity Level
An important factor in optimizing corn population is the productivity level of a field, which is why Corteva scientists target a range of different environments when placing population research studies. Pioneer research has shown that yield response to plant population depends on the yield environment. An analysis of 15 years of plant population response data showed that in low yielding environments (below 100 bu/acre), maximum yield was attained at an average population of 24,000 plants/acre. In very high yield environments (above 200 bu/acre), yield response to plant population continued to increase even at 40,000 plants/acre (Figure 7).


Figure 7. Corn hybrid response to plant population under four yield environments, a) low yielding <100 bu/acre; b) medium yielding 100-150 bu/acre; c) high yielding 150-180 bu/acre; and d) very high yielding 190-210 bu/acre (Ciampitti, 2018b).
Figure 8 shows plant population response curves for a current 111 CRM Pioneer® brand corn product tested in a wide range of yield environments. Agronomic optimum seeding rates range from around 30,000 seeds/acre at the low end of the yield level range to over 44,000 seeds/acre at the high end.

Figure 8. Corn yield response of a 111 CRM Pioneer® brand hybrid to seeding rate over a range of yield levels based on 4 years of testing across 36 locations.
Hybrid Difference in Population Response
Yield response to plant population can differ considerably among hybrids, making hybrid the second most important factor in seeding rate decisions behind field productivity level. Corteva scientists evaluate numerous hybrids each year in population research studies to better understand inherent differences in plant population response. Figure 9 shows an example of two hybrids of similar maturity with contrasting responses to plant population.

Figure 9. Corn yield response to seeding rate of two 99 CRM Pioneer® brand corn products with contrasting optimum seeding rates.
Data from Corteva plant population studies are used to assign ear flex ratings to Pioneer hybrids. Ear flex is the degree to which harvestable yield of the plant changes in response to environmental stress. There are many environmental factors that create stress on a plant, but one source of stress that is essentially always present is competition with other corn plants. All hybrids will produce smaller ears as plant population increases, but the rate of change can differ among hybrids. The optimum plant population is the point at which the tradeoff between the number of plants per unit area and the yield per plant results in the greatest yield. Ear flex can be a product of changes in both the number of kernels per ear and kernel mass.
Ear flex ratings for Pioneer hybrids are based on the difference in yield per plant at 18,000 plants/acre and 42,000 plants/acre. The larger this difference is, the more ear flex a hybrid is considered to have. Hybrids are indexed against an average and rated on a 1 to 9 scale, with most current commercial products scored between 4 and 7.
Figure 10 shows an example of yield per plant response to seeding rate of three different hybrids with low, medium, and high ear flex scores. Fixed-ear hybrids generally maximize yield at a higher population than flex-ear hybrids.

Figure 10. Corn yield per plant response to seeding rate for three 99 CRM hybrids with low, medium, and high ear flex scores.
Pioneer Planting Rate Estimator
The Pioneer Planting Rate Estimator, available on www.pioneer.com, allows users to generate estimated optimum seeding rates for Pioneer® brand corn products based on data from Corteva research studies (Appendix). The Planting Rate Estimator provides flexibility in customizing the graph display based on grain prices and seed costs.
The Pioneer Planting Rate Estimator has the ability to display population response curves for a wide range of yield levels, which can provide guidelines for creating variable rate seeding prescriptions. It is possible to display plant population response curves at 10 bu/acre increments for all yield levels where there was a statistically significant response based on the available research data. The yield levels available for display will vary among hybrids based on the available research data. Users also have the option of selecting a “Water-Limited Sites” version of the planting rate estimator, which includes data from studies conducted in drought environments. Farmers should use the Planting Rate Estimator as an initial guide and work with their Pioneer sales professional for refinements based on local observations and on-farm trials.
Seeding Rate Tips
Challenging growing environments may reduce corn plant populations below optimum levels. These conditions can occur when planting into no-till or high-residue seedbeds, or cloddy or compacted soils. Soil-borne diseases and soil insects can also diminish stands. All of these factors can interact to challenge stand establishment, and effects are magnified when planting early into cold, wet soils. Therefore, consider the following points when choosing your seeding rate:
- In general, plan to drop 5% more seeds than the target population to account for germination or seedling losses.
- Boost target seeding rates by an additional 5% for extreme or challenging environments such as those described in the paragraph above.
- In areas with perennial drought stress, seeding rate targets are lower. Base your seeding rate on the specific hybrid population response at the historical yield level of the field.
- Consult your Pioneer sales professional for optimum economic seeding rates of each Pioneer® brand corn product, as well as hybrid placement tips and other helpful management suggestions.
References
- Ciampitti, I. 2018a. Trends in Optimum Plant Density and Yields Gains for Corn in North America. Pioneer Agronomy Research Update.
- Ciampitti, I. 2018b. Corn Hybrid Response to Plant Population: A Review for North America. Pioneer Agronomy Research Update.
- USDA NASS. 2025. Quick Stats.
Appendix - Pioneer Planting Rate Estimator
- The Pioneer Planting Rate Estimator, available on www.pioneer.com, allows users to generate estimated optimum seeding rates for Pioneer brand corn products based on data from Corteva Agriscience research trials.
Pioneer Planting Rate Estimator Features
- The Planting Rate Estimator provides flexibility in customizing the graph display based on grain prices and seed costs.
- The Planting Rate Estimator has the ability to display population response curves for a wide range of yield levels, which can provide guidelines for creating variable rate seeding prescriptions.
- It is possible to display plant population response curves at 10 bu/acre increments for all yield levels where there was a statistically significant response based on the available research data.
- The yield levels available for display will vary among hybrids based on the available research data.
- Users also have the option of selecting a “Water-Limited Sites” version of the planting rate estimator, which includes data from studies conducted in drought environments.
- Growers should use the Planting Rate Estimator as an initial guide and work with their Pioneer sales professional for refinements based on local observations and on-farm trials.

Click here or on the image above for a larger view.
Find the Right Product for Every Acre
The best genetics, top trait packages and extensive local field knowledge combine to deliver new products with proven performance consistency across years and environments. Use Pioneer® brand corn products to maximize yield potential on every acre.
Find Local Products
The foregoing is provided for informational use only. Contact your Pioneer sales professional for information and suggestions specific to your operation. Product performance is variable and subject to any number of environmental, disease, and pest pressures. Individual results may vary. Pioneer® brand products are provided subject to the terms and conditions of purchase which are part of the labeling and purchase documents.